Notice of 2025 Annual Meeting and Proxy Statement
Go to Home
Open index
Search
Index
Front Cover
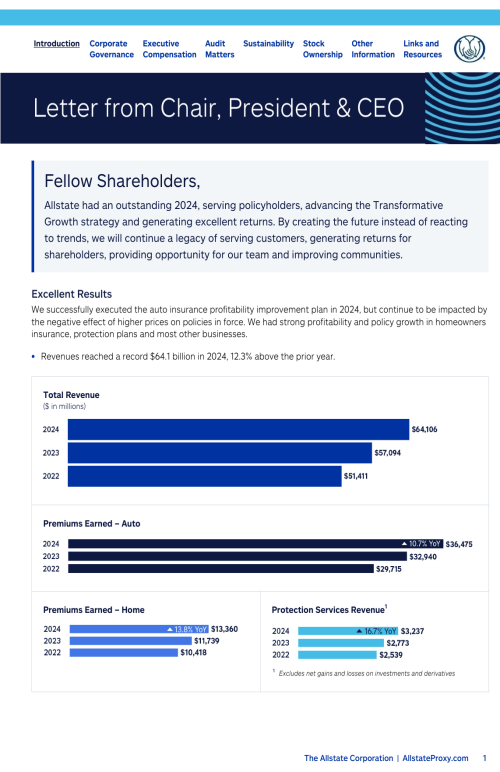
Letter from Chair, President & CEO
Letter from Independent Directors
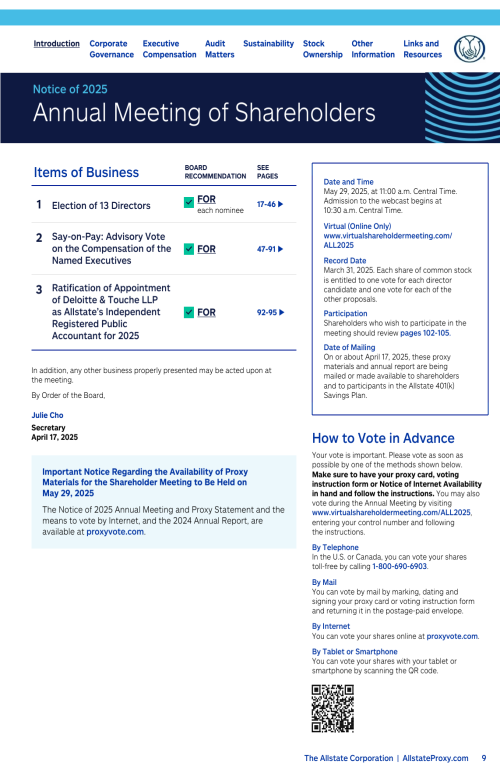
Notice of 2025 Annual Meeting of Shareholders
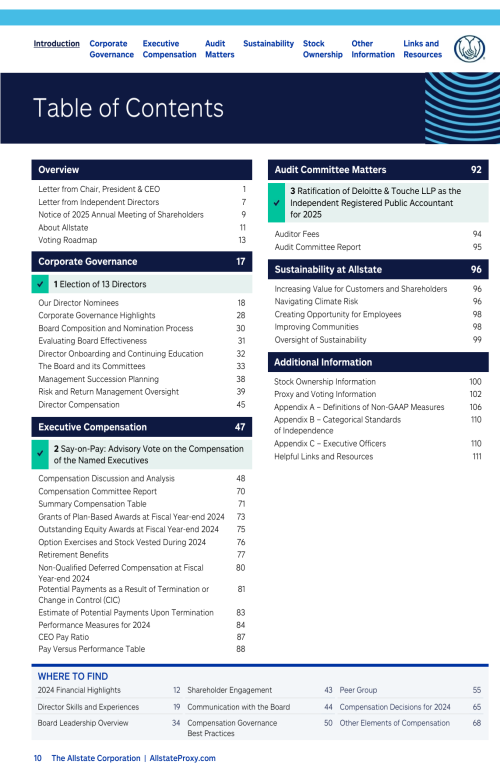
Table of Contents
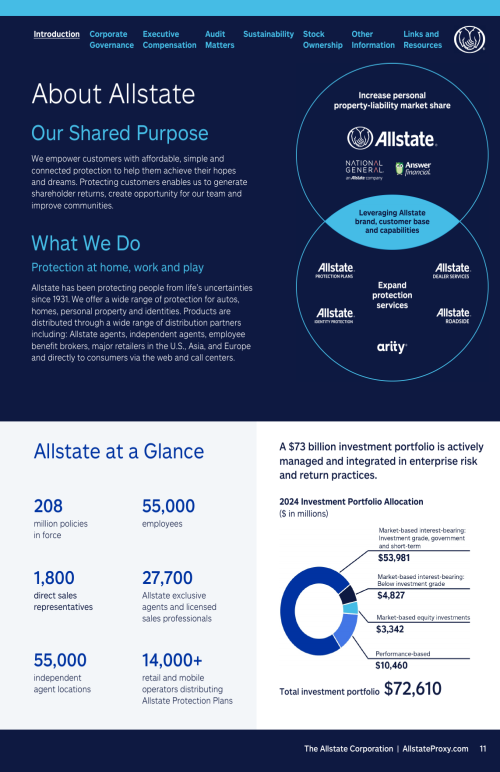
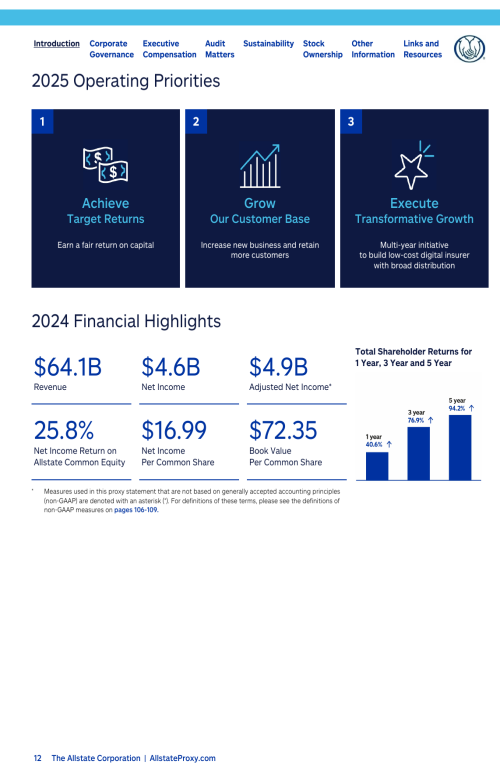
About Allstate
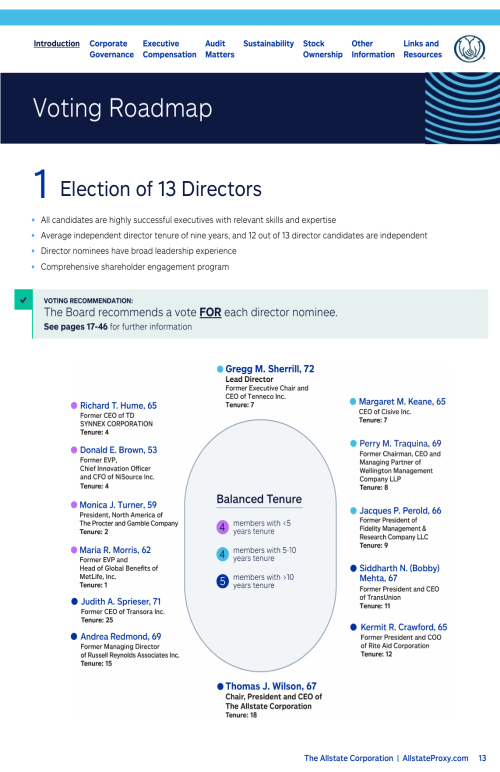
Voting Roadmap
Corporate Governance
Proposal 1 Election of 13 Directors
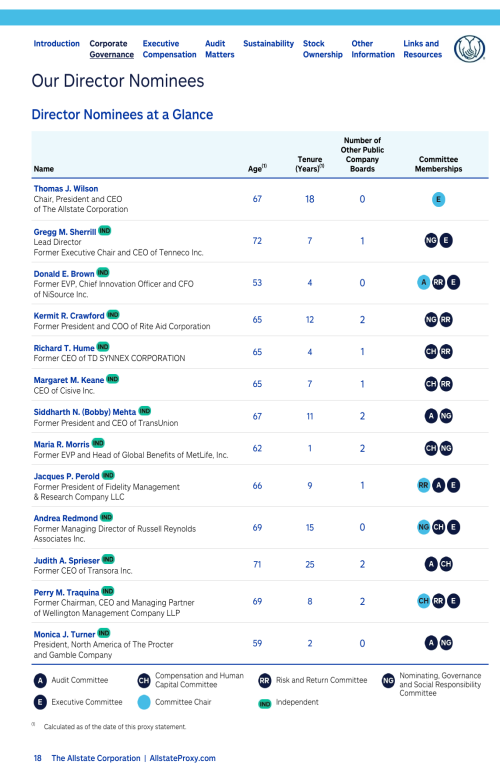
Our Director Nominees
Corporate Governance Highlights
Board Composition and Nomination Process
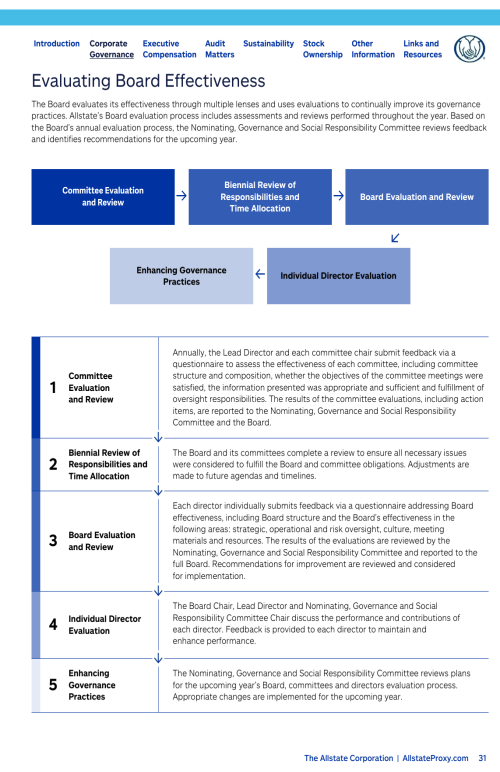
Evaluating Board Effectiveness
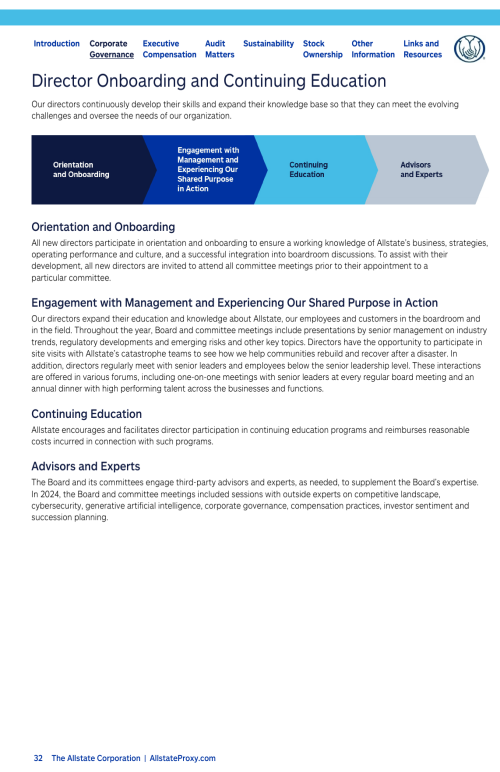
Director Onboarding and Continuing Education
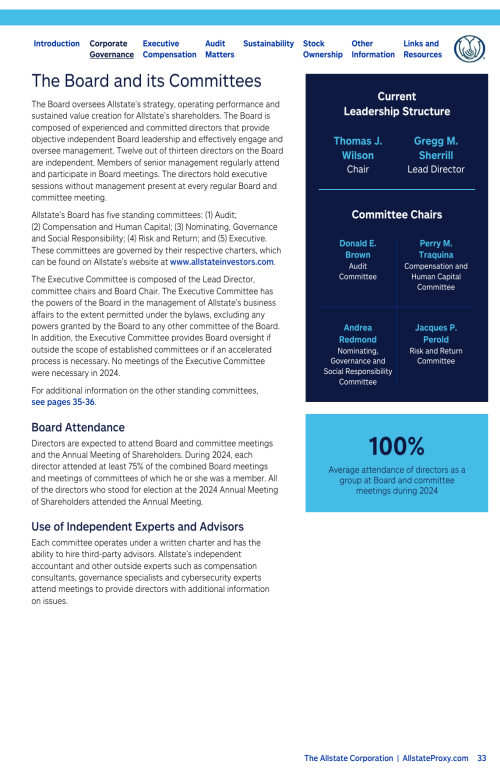
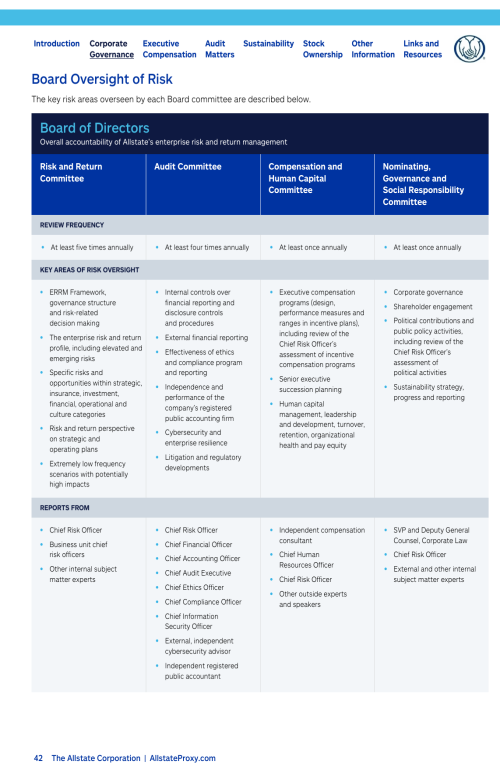
The Board and its Committees
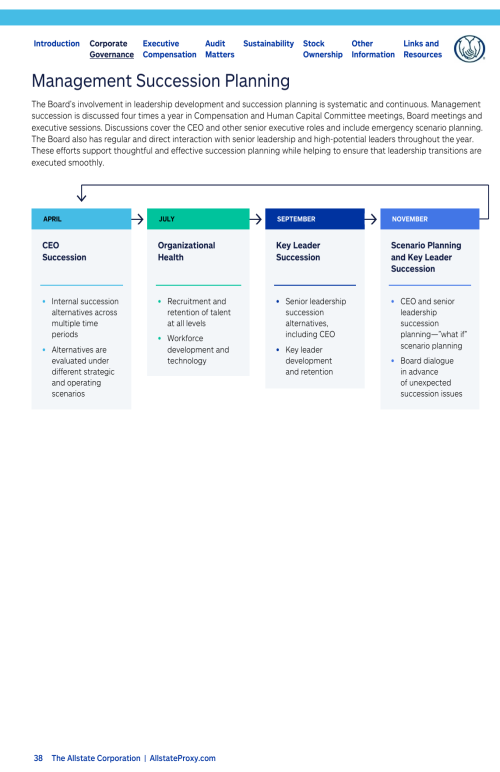
Management Succession Planning
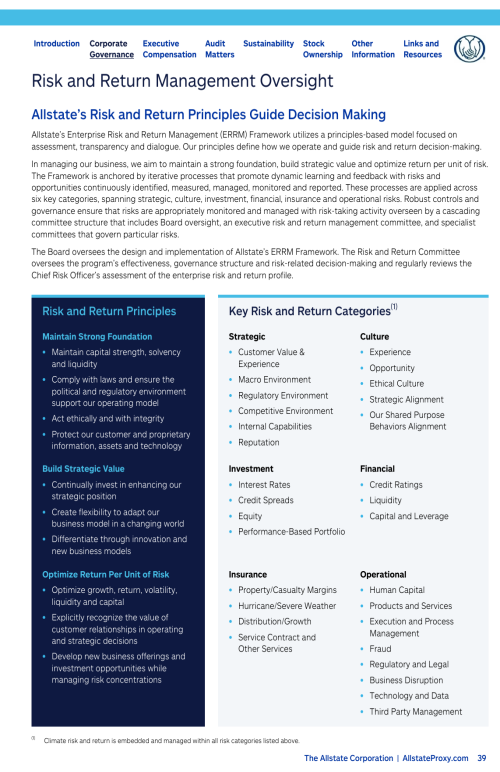
Risk and Return Management Oversight
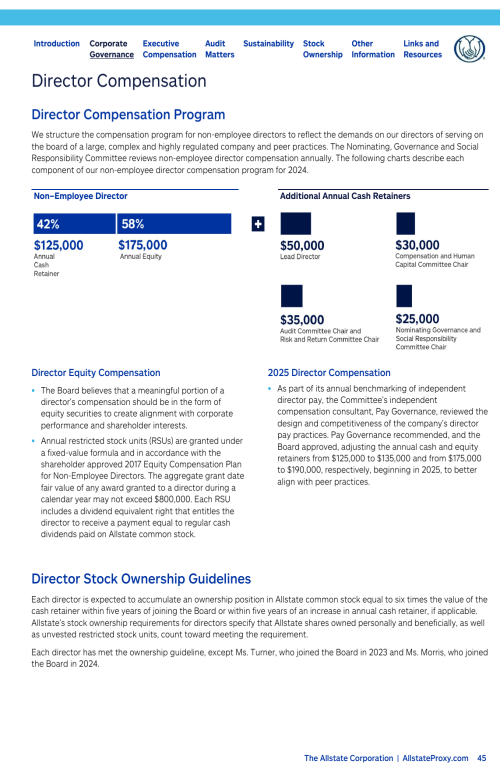
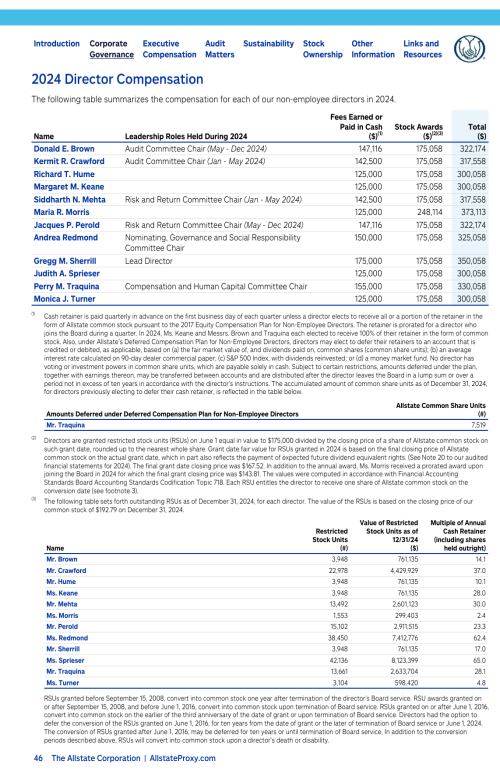
Director Compensation
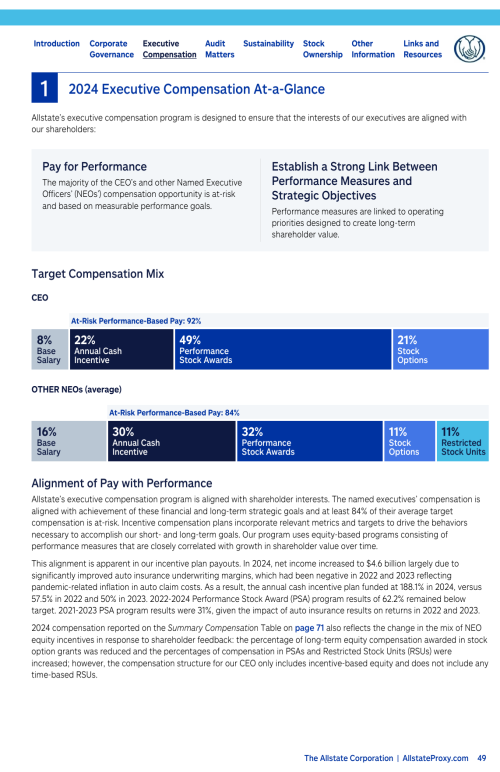
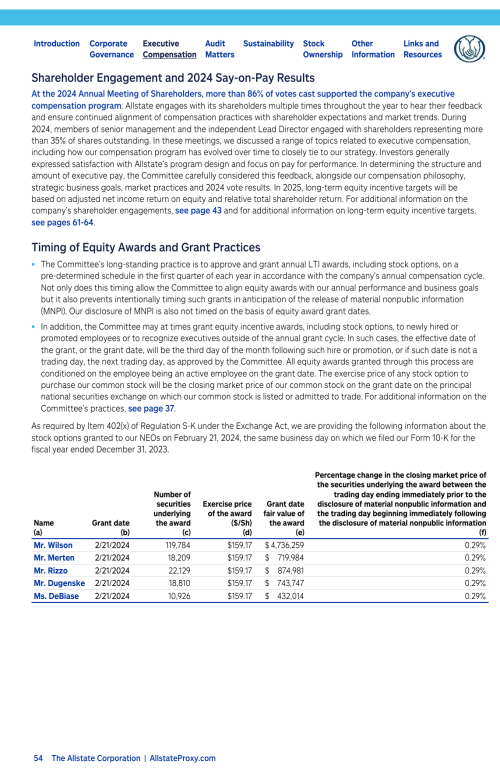
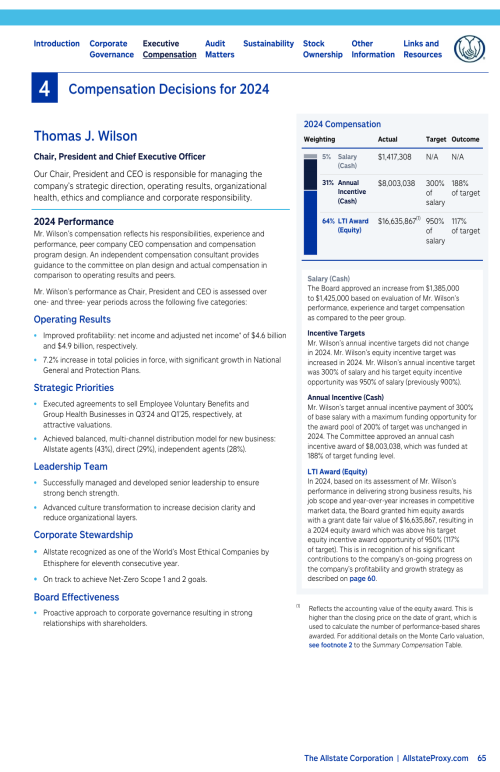
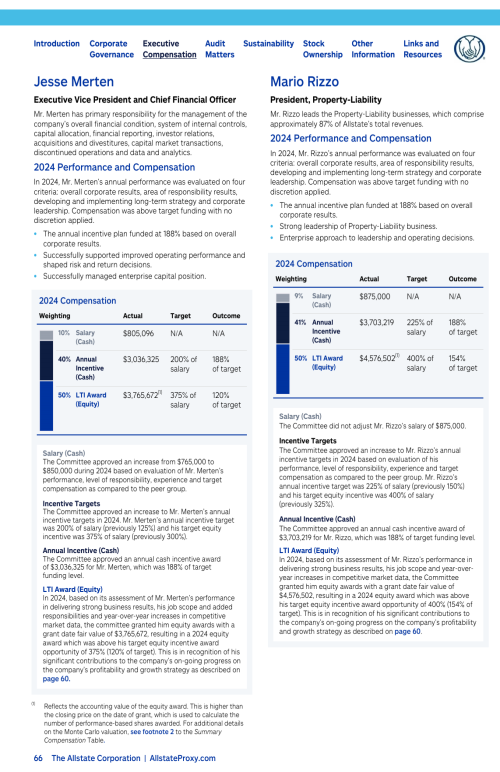
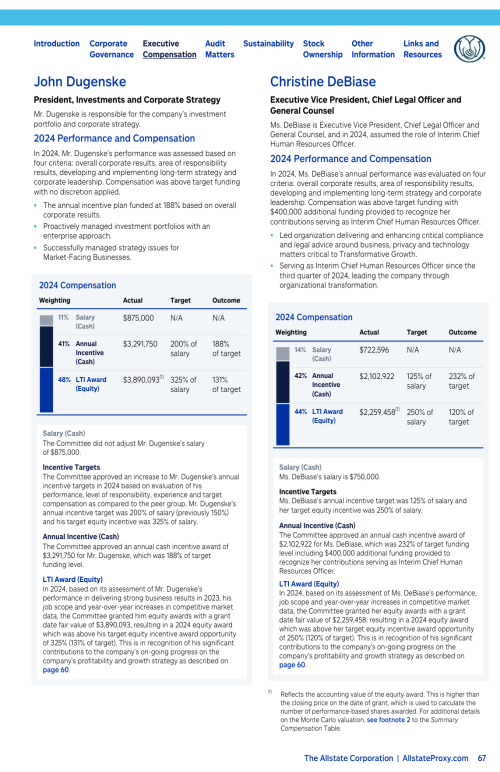
Executive Compensation
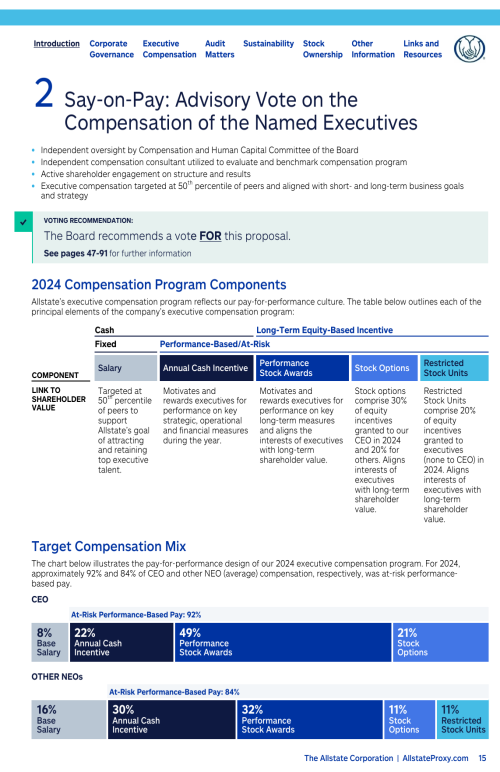
Proposal 2 Say-on-Pay: Advisory Vote on the Compensation of the Named Executives
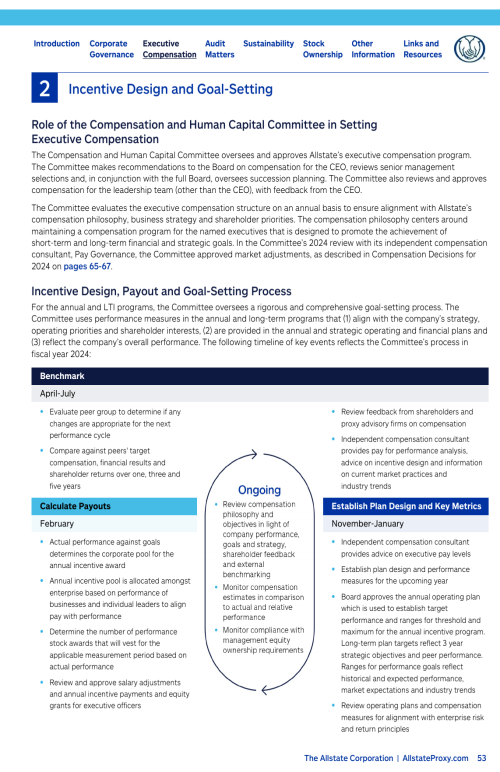
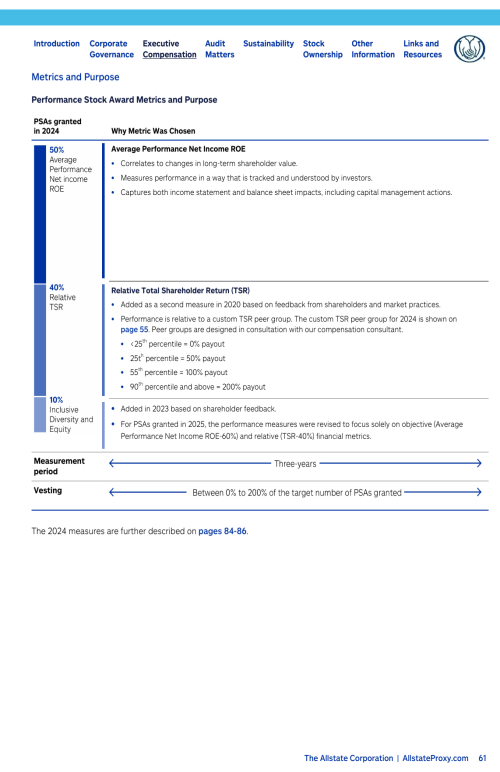
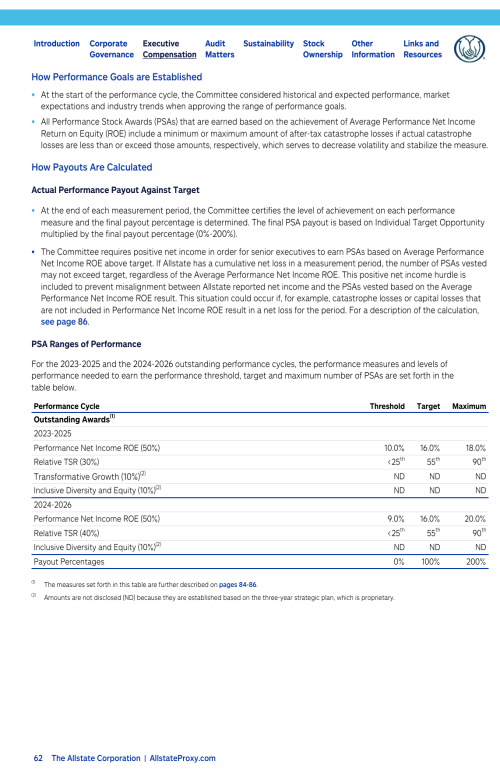
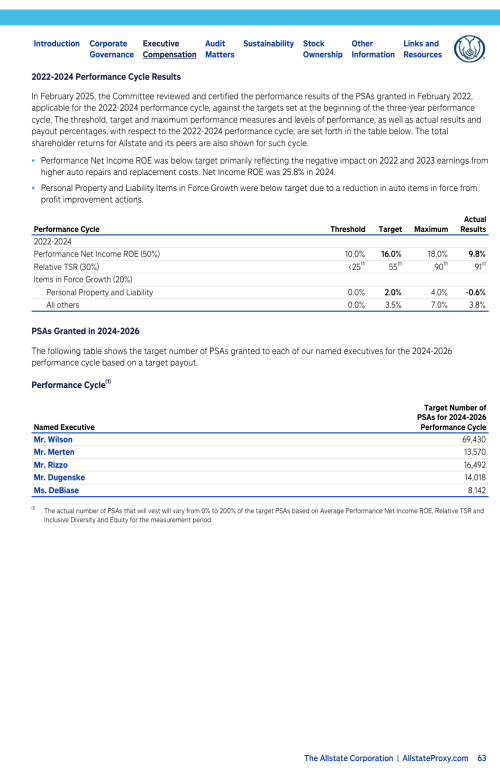
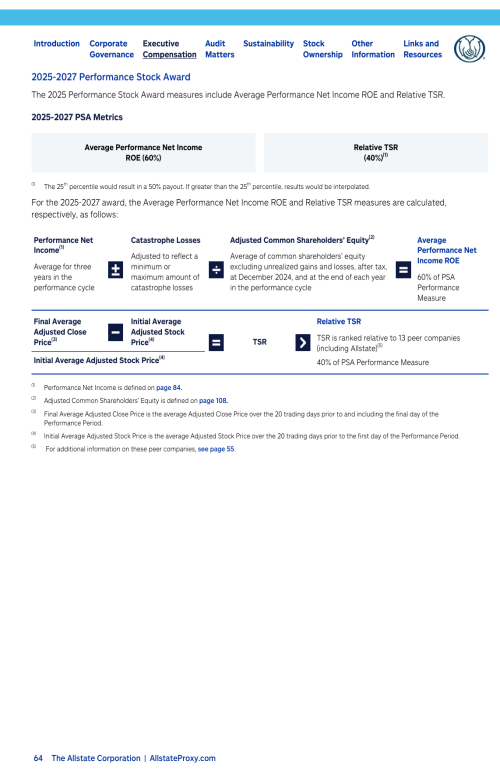
Compensation Discussion and Analysis
Compensation Committee Report
Summary Compensation Table
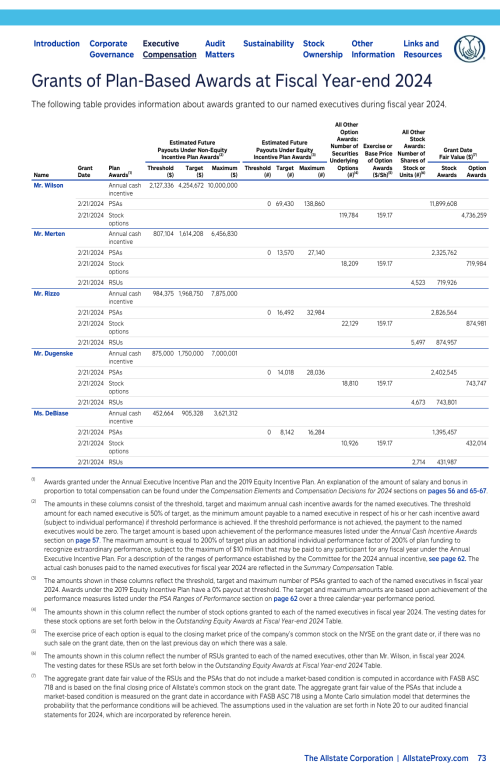
Grants of Plan-Based Awards at Fiscal Year-end 2024
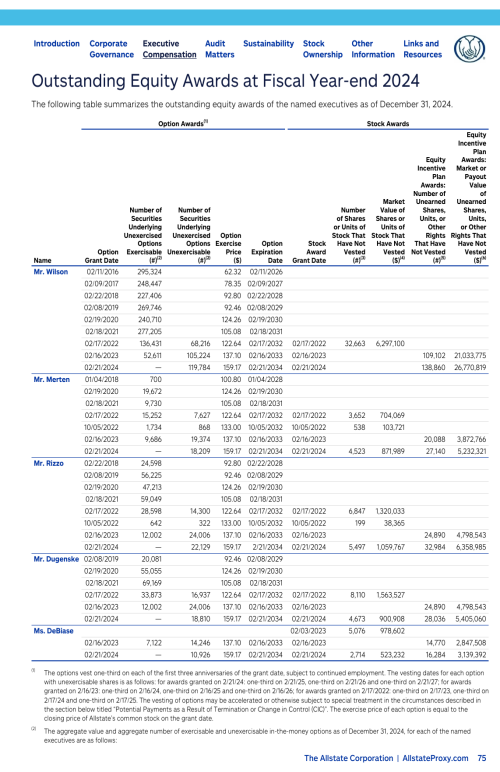
Outstanding Equity Awards at Fiscal Year-end 2024
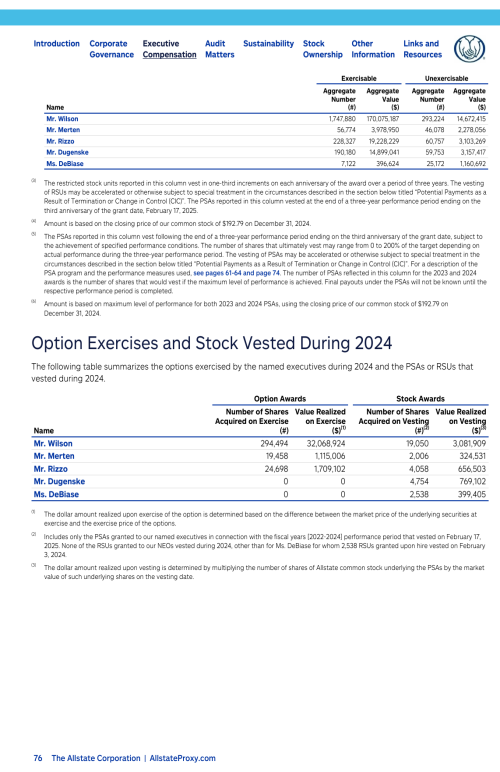
Option Exercises and Stock Vested During 2024
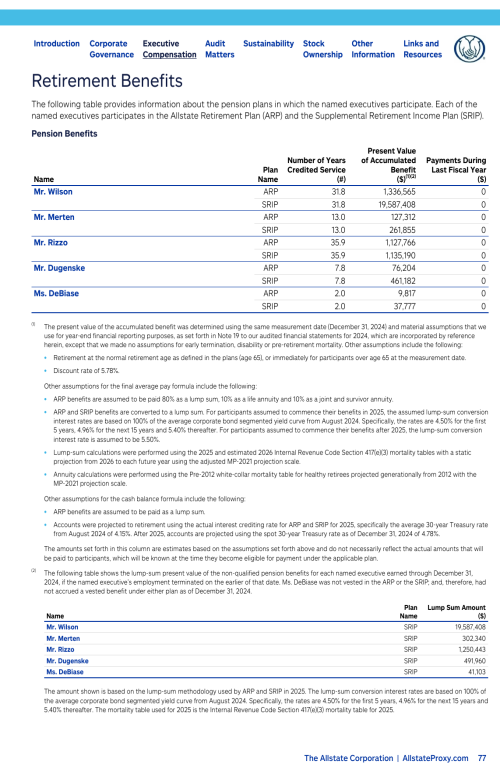
Retirement Benefits
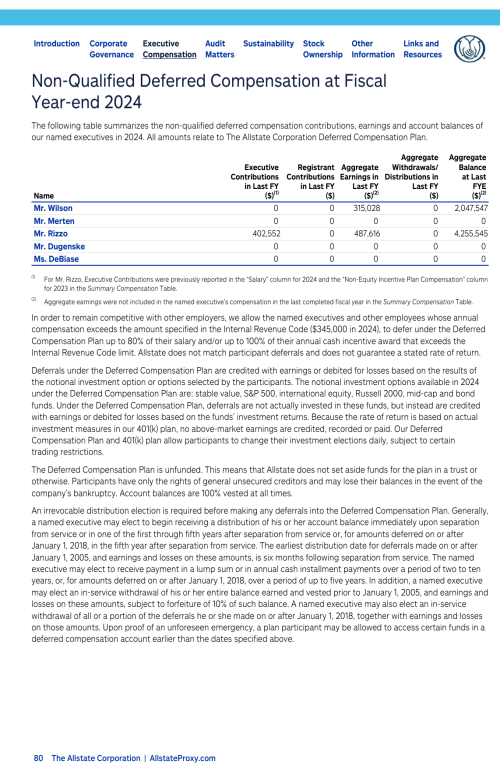
Non-Qualified Deferred Compensation at Fiscal Year-end 2024
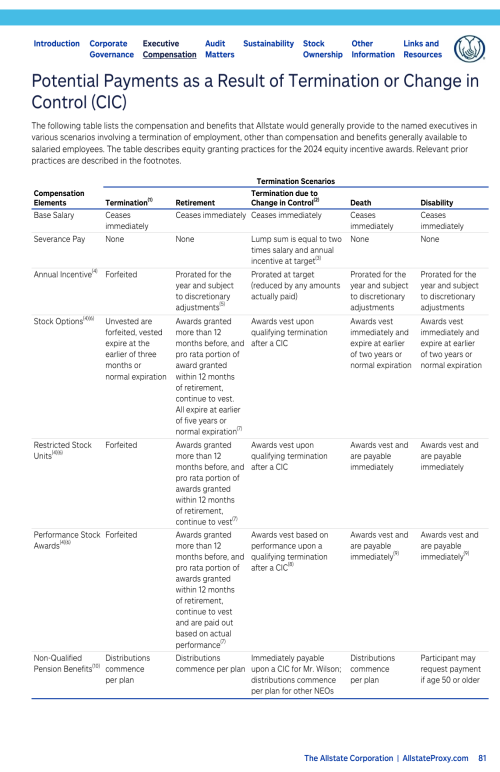
Potential Payments as a Result of Termination or Change in Control (CIC)
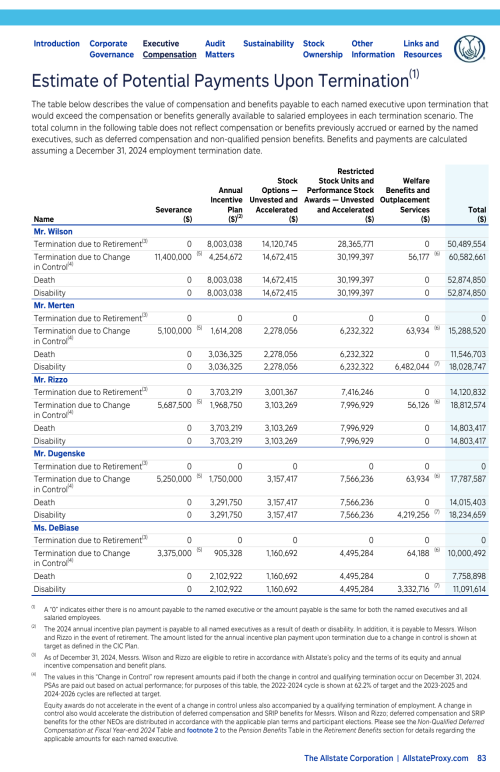
Estimate of Potential Payments Upon Termination
CEO Pay Ratio
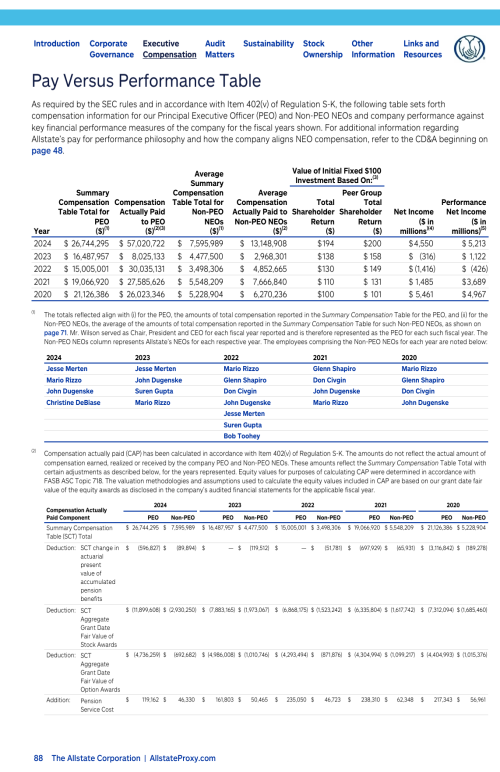
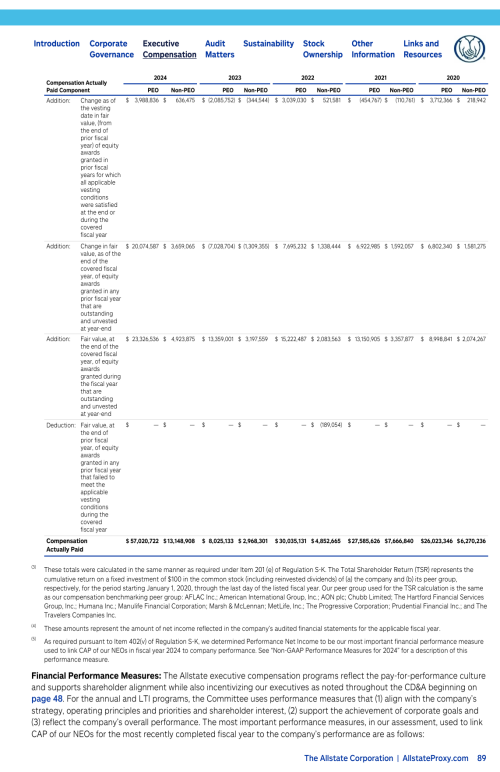
Pay Versus Performance Table
Audit Committee Matters
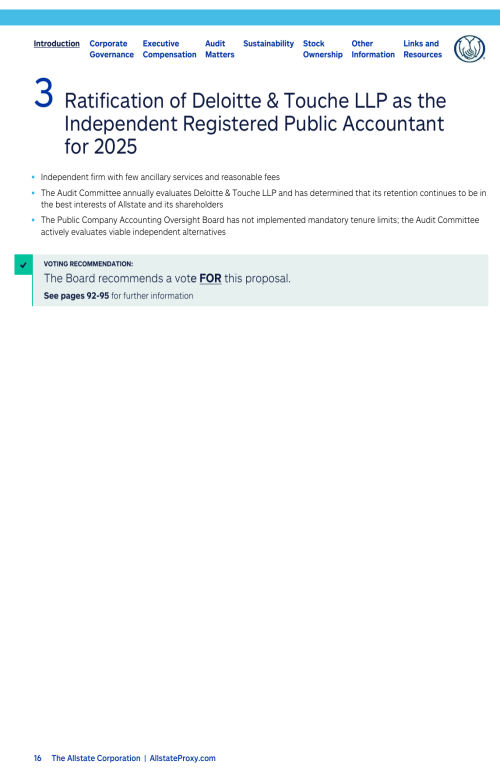
Proposal 3 Ratification of Deloitte & Touche LLP as the Independent Registered Public Accountant for 2025
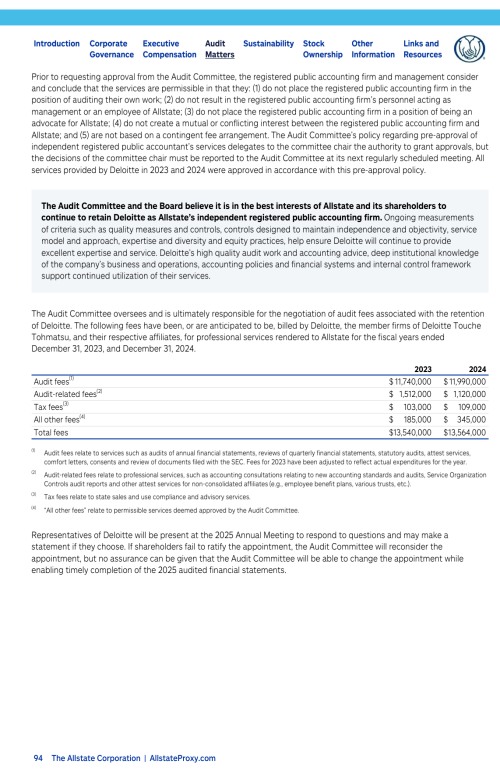
Auditor Fees
Audit Committee Report
Sustainability at Allstate
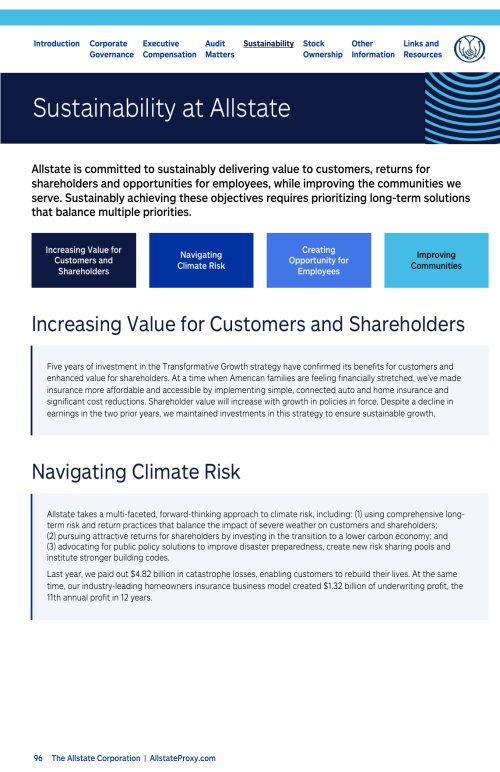
Increasing Value for Customers and Shareholders
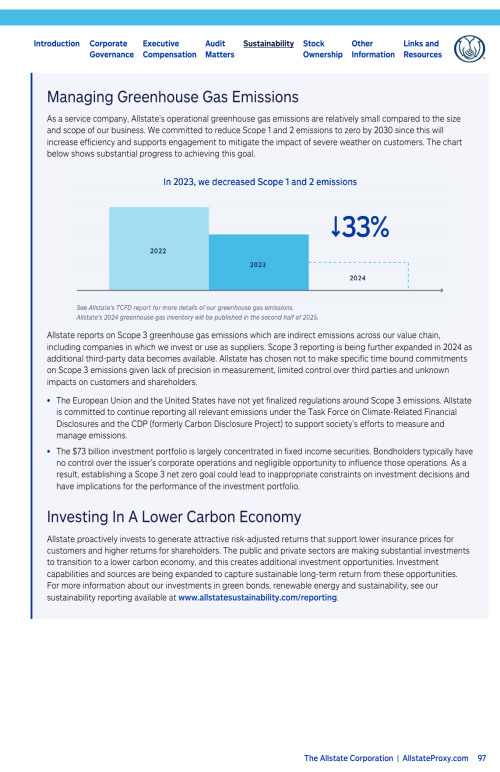
Navigating Climate Risk
Creating Opportunity for Employees
Improving Communities
Oversight of Sustainability
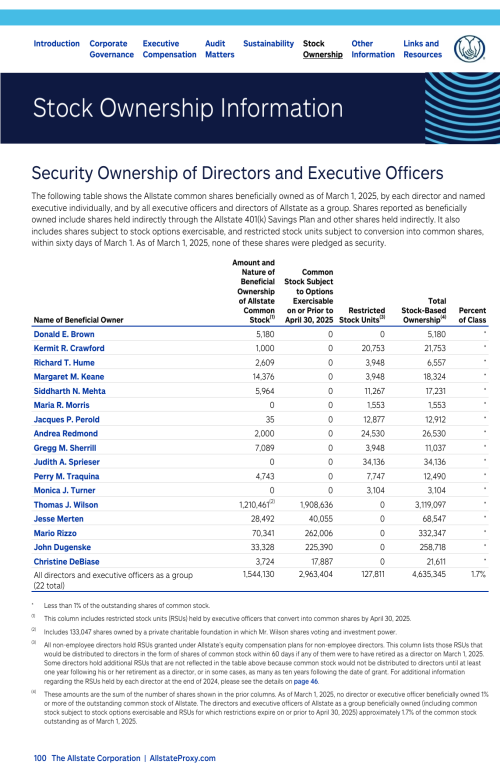
Stock Ownership Information
Proxy and Voting Information
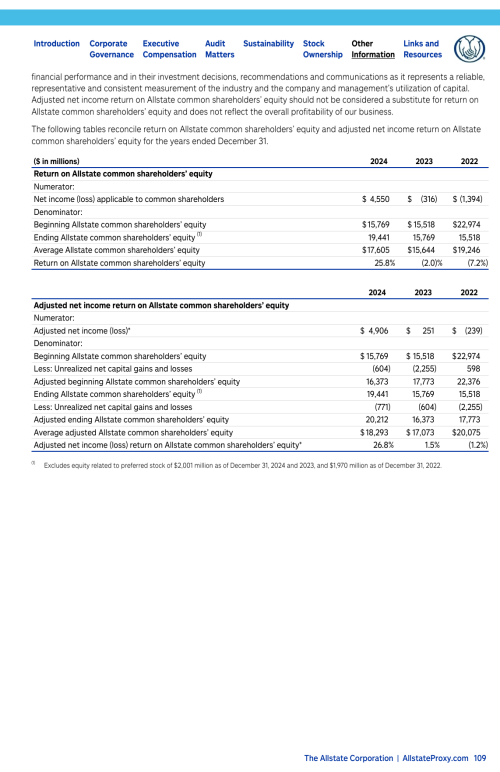
Appendix A – Definitions of Non-GAAP Measures
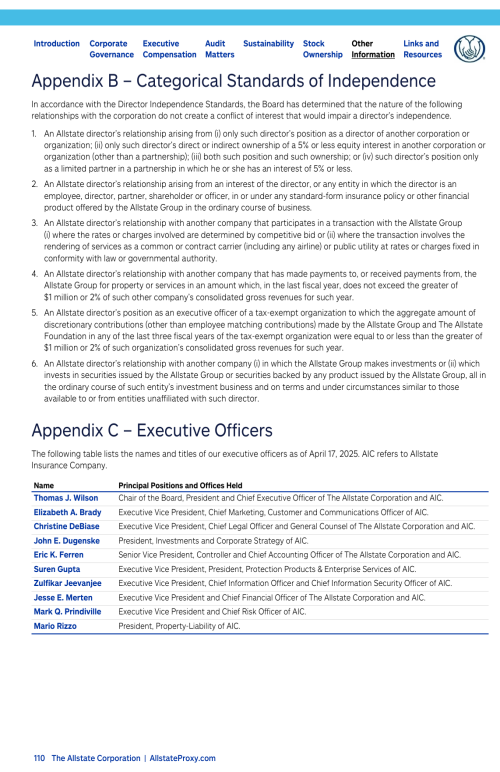
Appendix B – Categorical Standards of Independence
Appendix C – Executive Officers
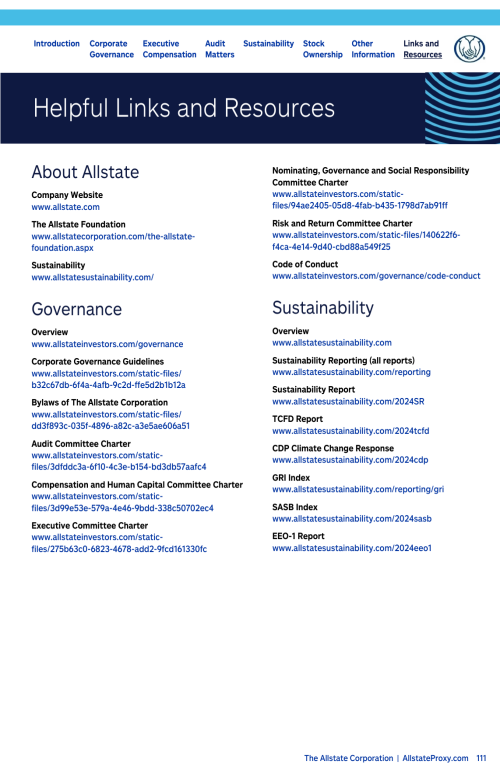
Helpful Links and Resources
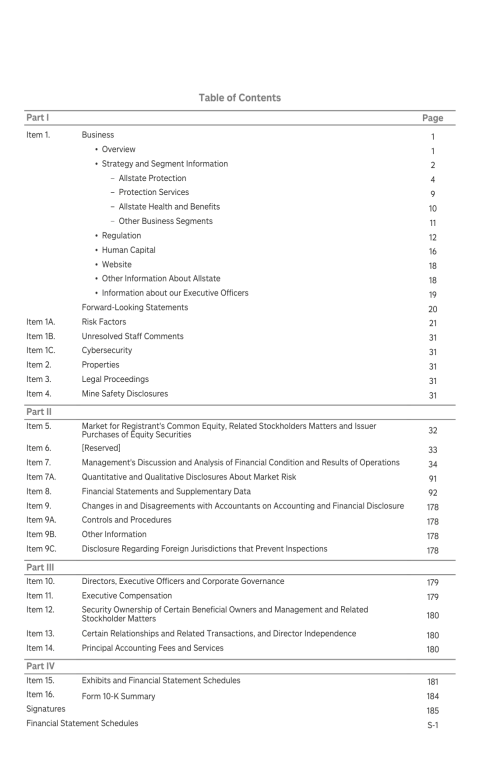
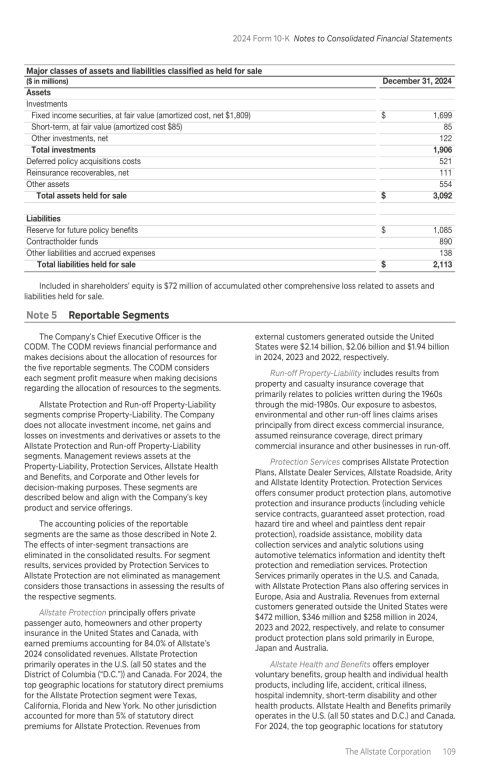
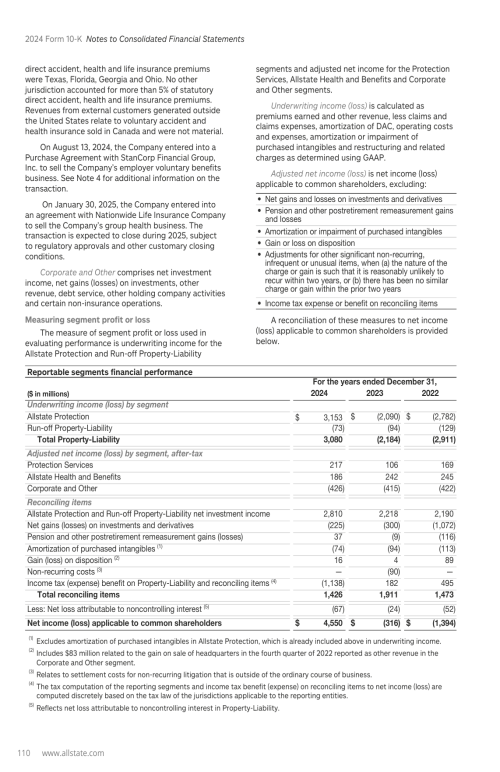
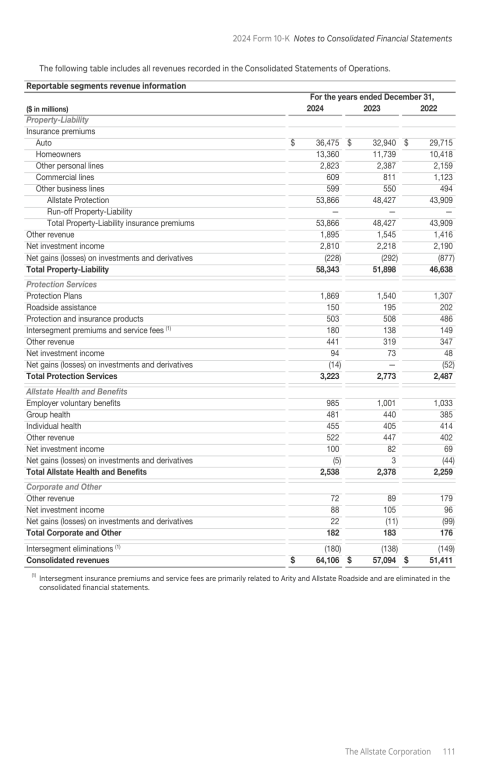
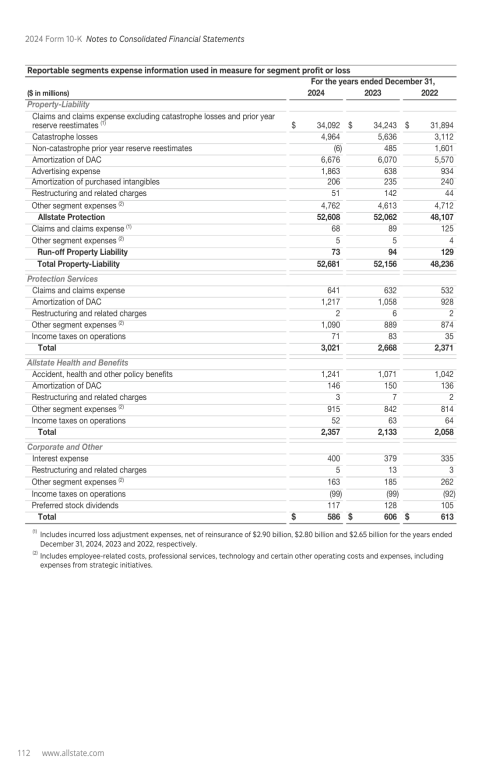
Table of Contents 10K
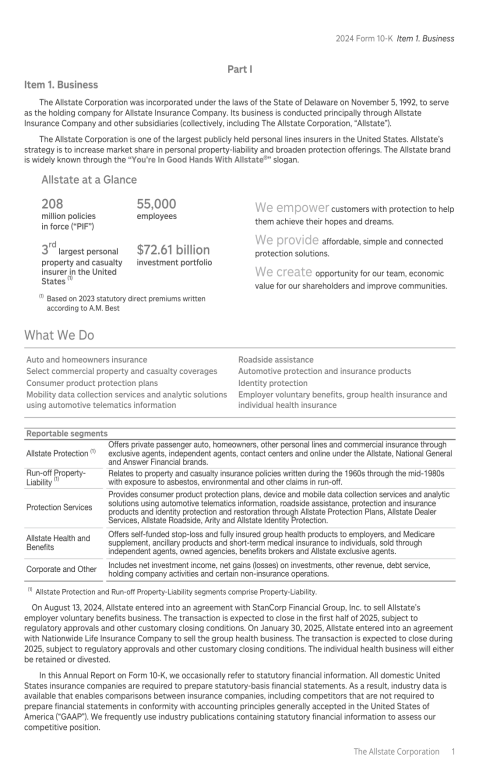
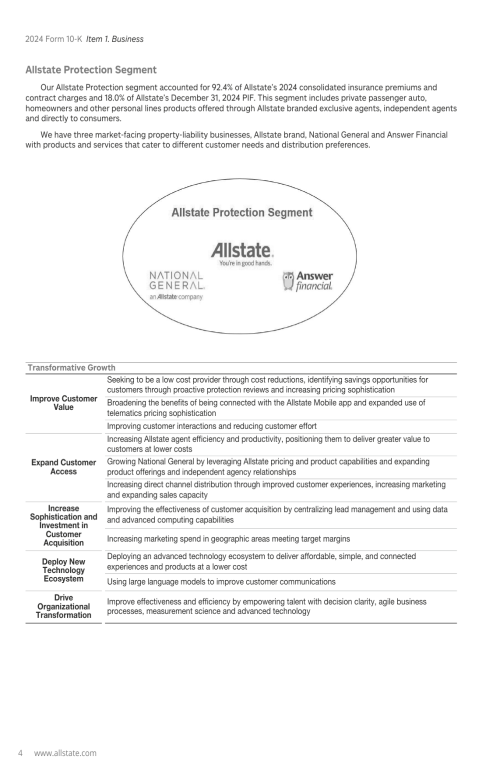
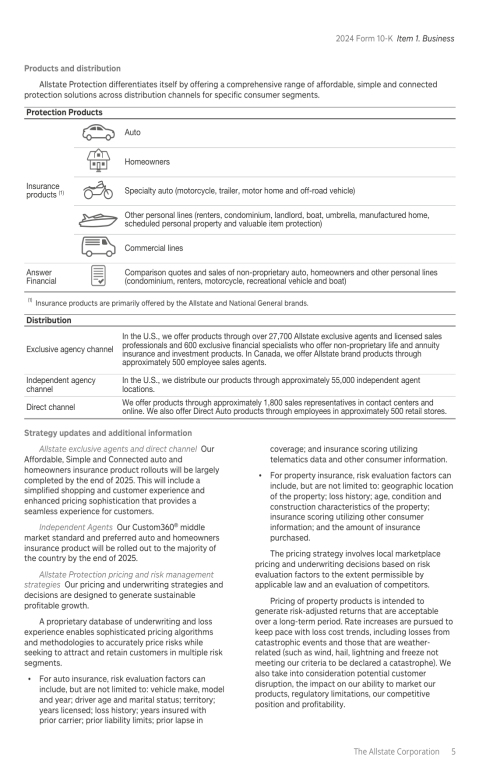
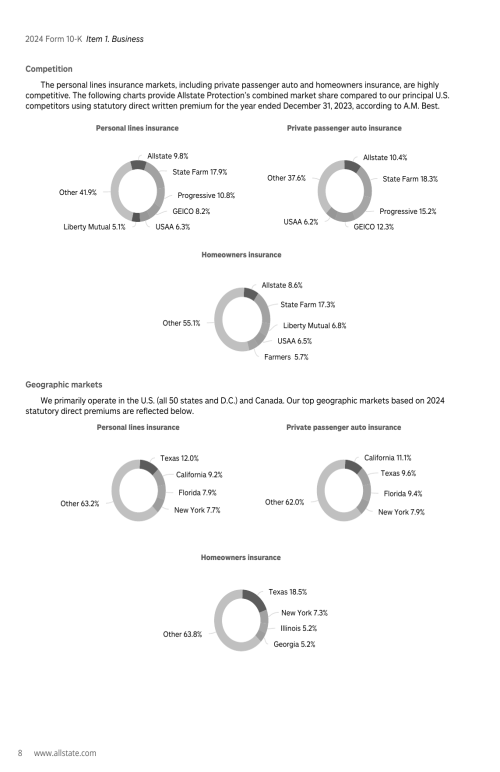
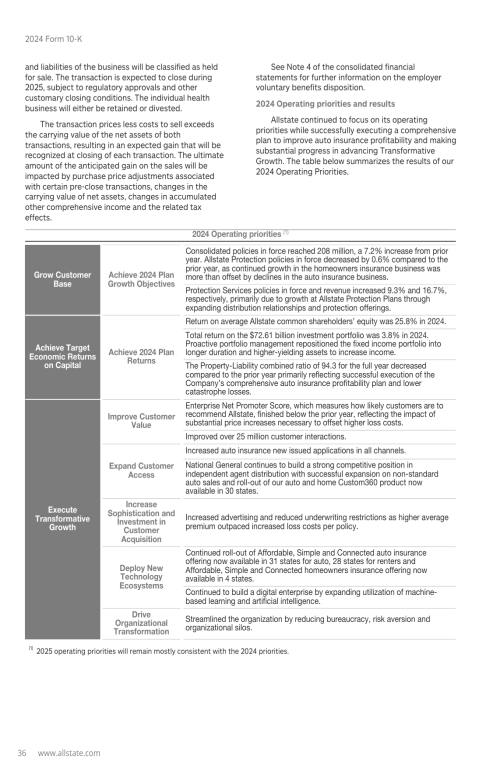
Item 1. Business
Overview
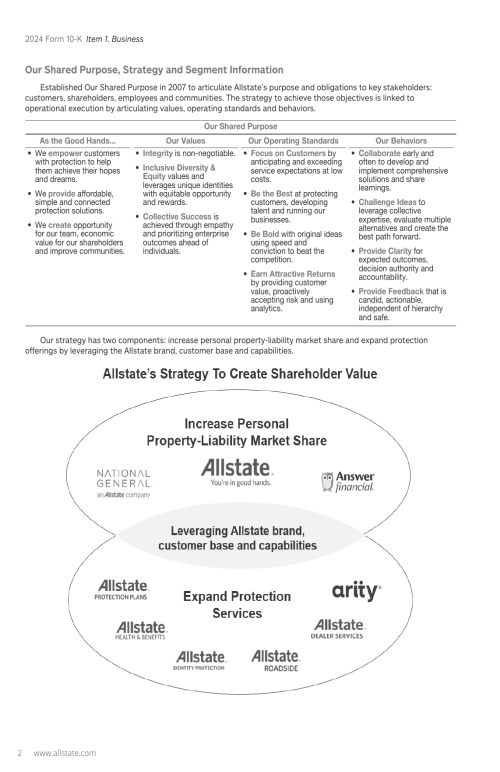
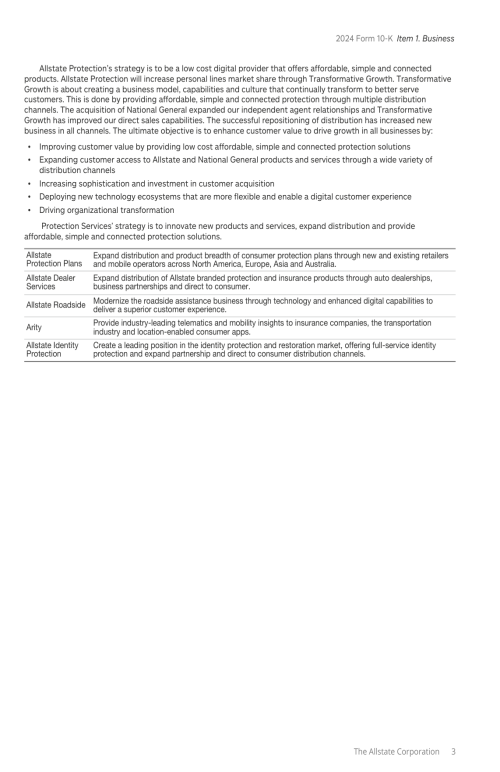
Strategy and Segment Information
Regulation
Human Capital
Website
Other Information About Allstate
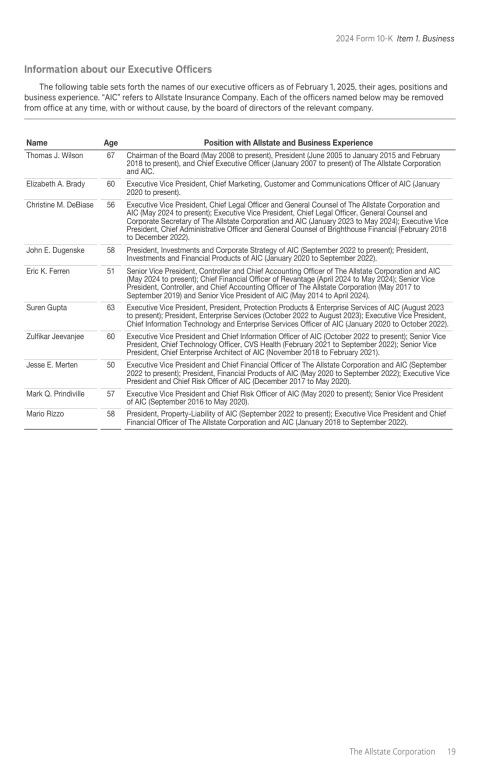
Information about our Executive Officers
Forward-Looking Statements
Item 1A. Risk Factors
Item 1B. Unresolved Staff Comments
Item 1C. Cybersecurity
Item 2. Properties
Item 3. Legal Proceedings
Item 4. Mine Safety Disclosures
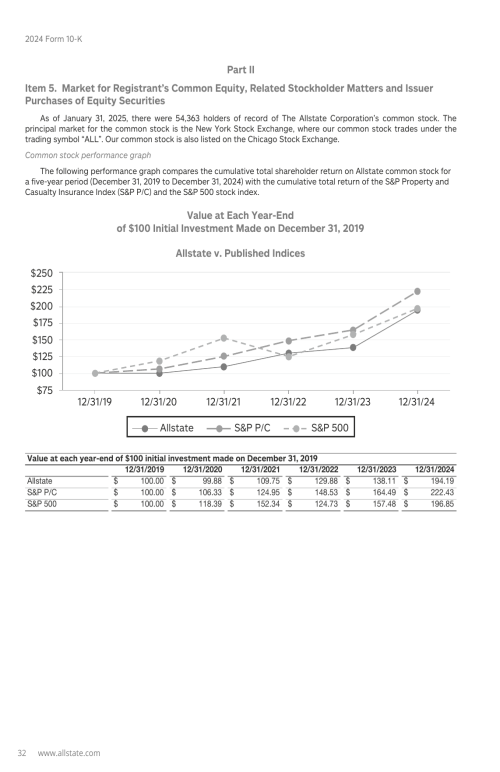
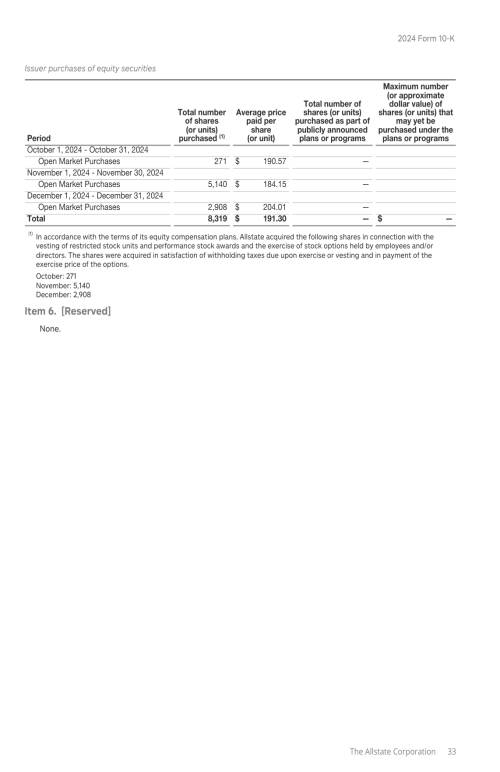
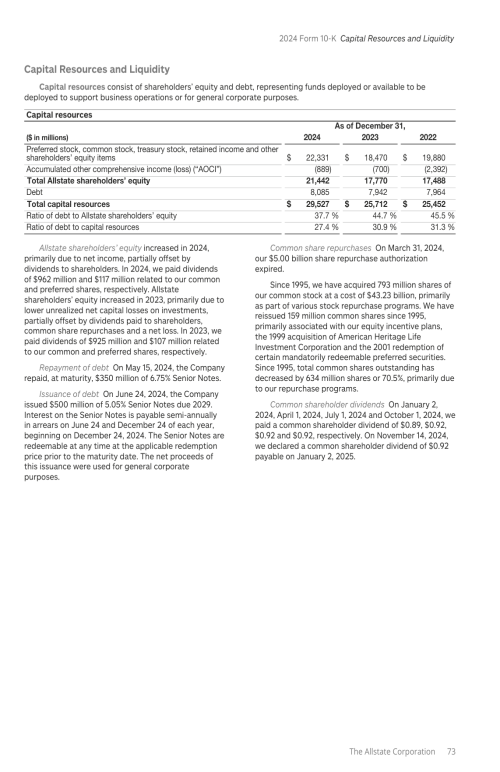
Item 5. Market for Registrant's Common Equity, Related Stockholders Matters and Issuer Purchases of Equity Securities
Item 6. [Reserved]
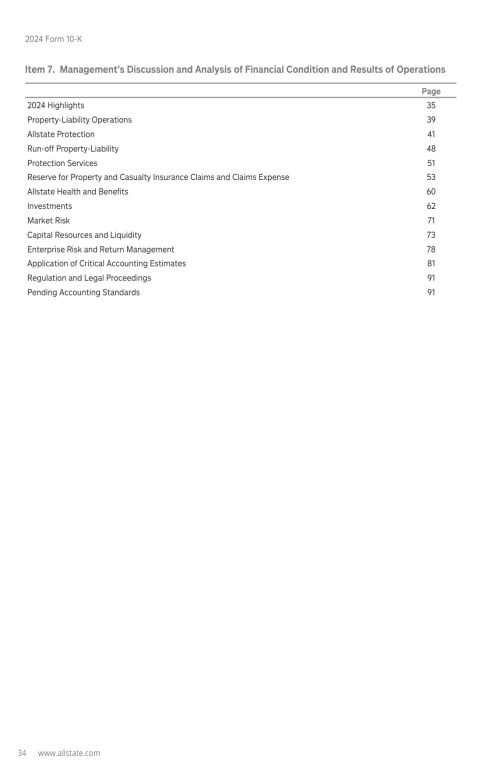
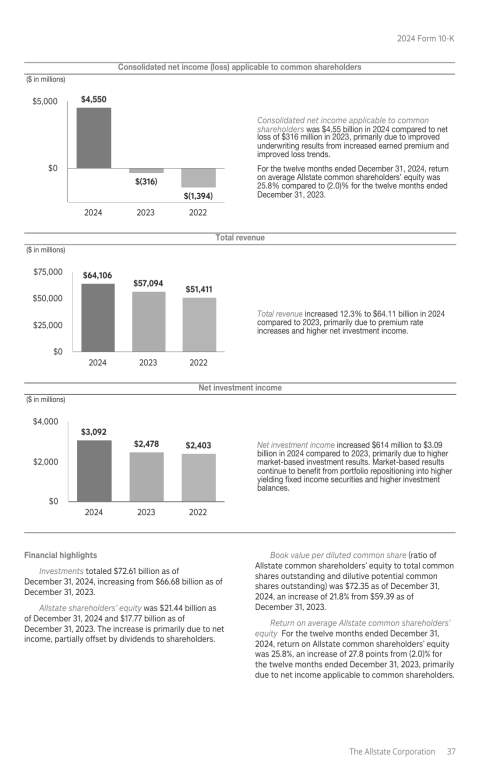
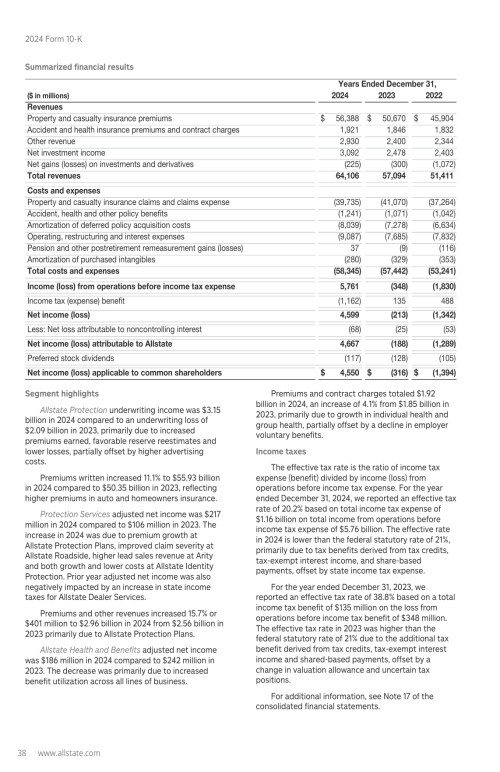
Item 7. Management's Discussion and Analysis of Financial Condition and Results of Operations
Item 7A. Quantitative and Qualitative Disclosures About Market Risk
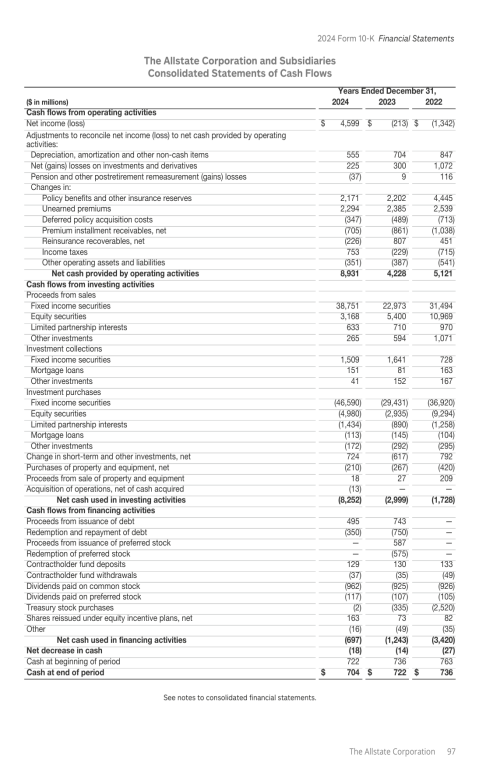
Item 8. Financial Statements and Supplementary Data
Item 9. Changes in and Disagreements with Accountants on Accounting and Financial Disclosure
Item 9A. Controls and Procedures
Item 9B. Other Information
Item 9C. Disclosure Regarding Foreign Jurisdictions that Prevent Inspections
Item 10. Directors, Executive Officers and Corporate Governance
Item 11. Executive Compensation
Item 12. Security Ownership of Certain Beneficial Owners and Management and Related Stockholder Matters
Item 13. Certain Relationships and Related Transactions, and Director Independence
Item 14. Principal Accounting Fees and Services
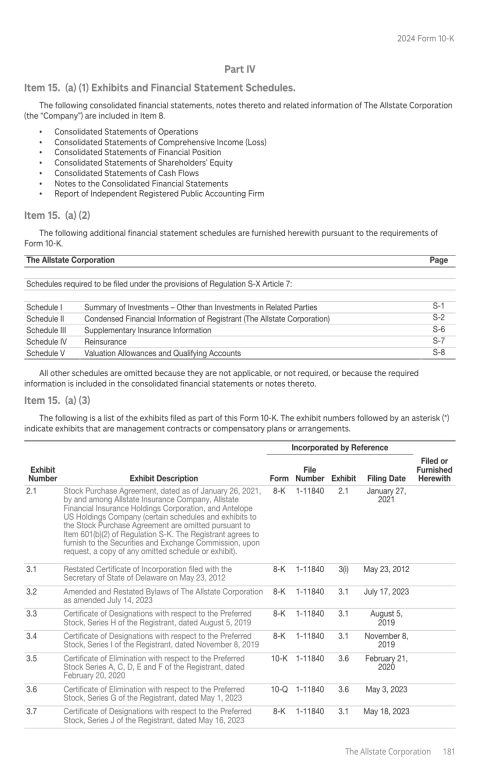
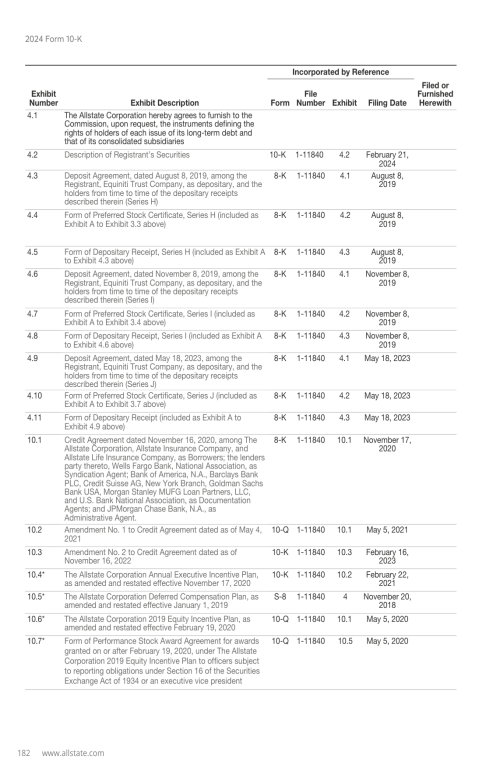
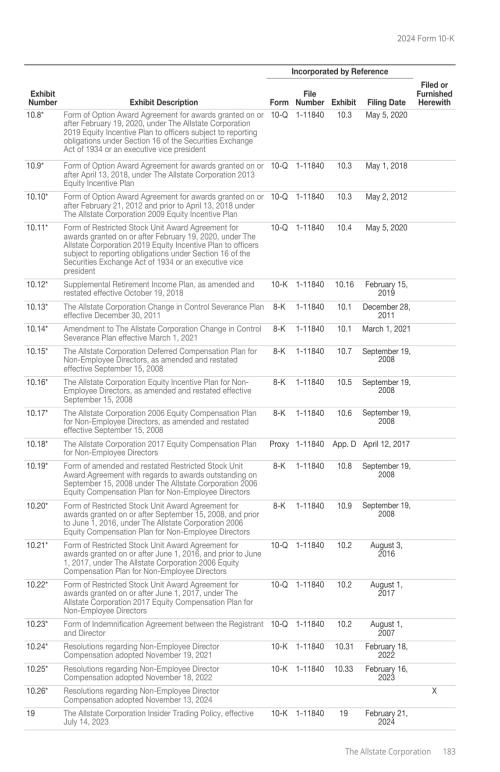
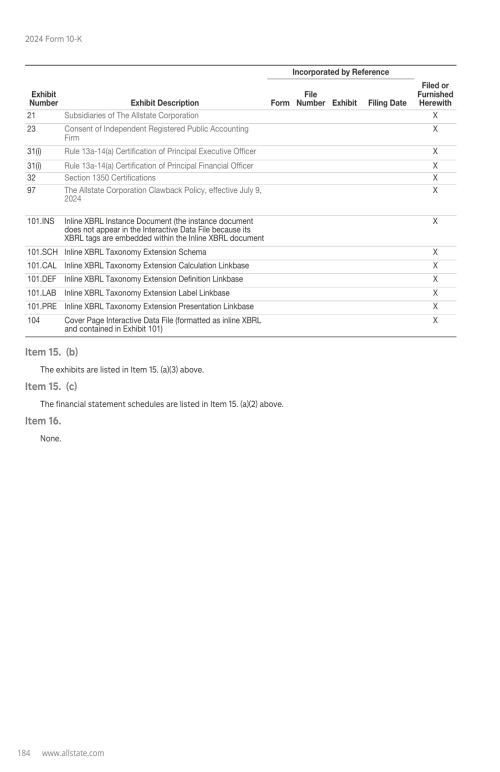
Item 15. Exhibits and Financial Statement Schedules
Item 16. Form 10-K Summary
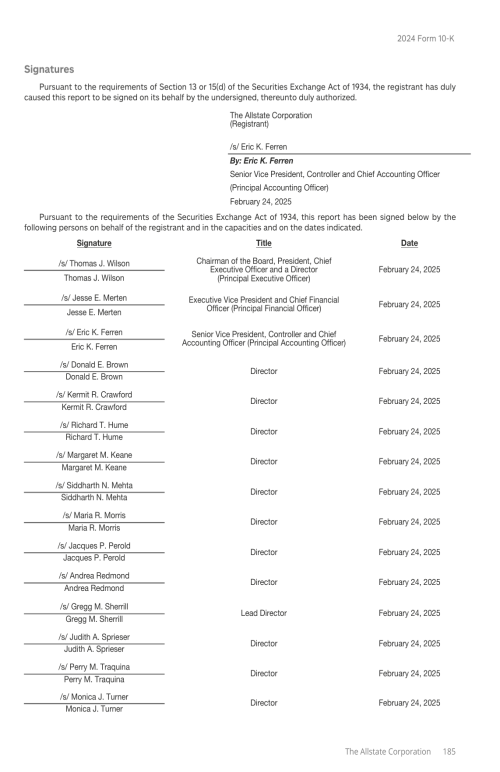
Signatures
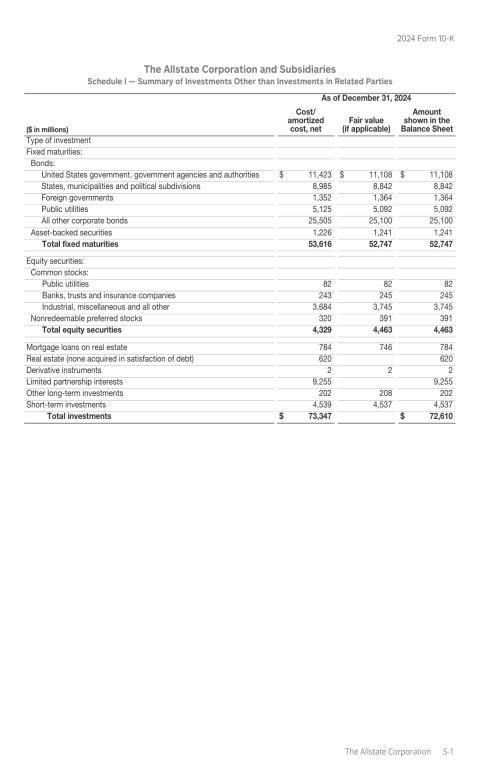
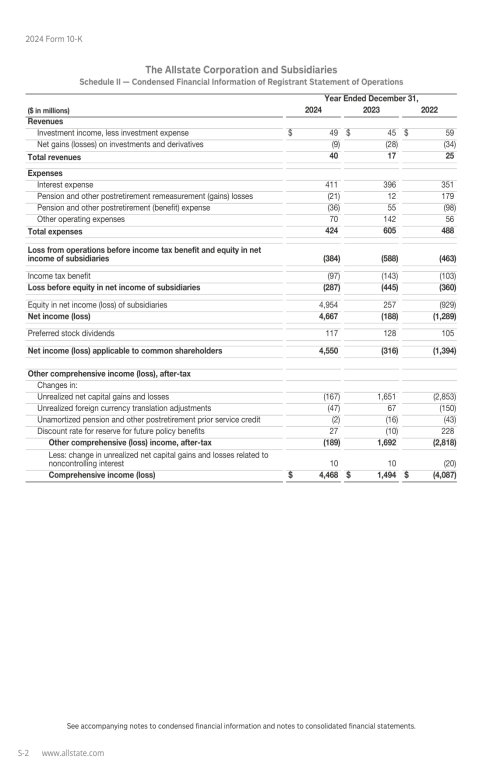
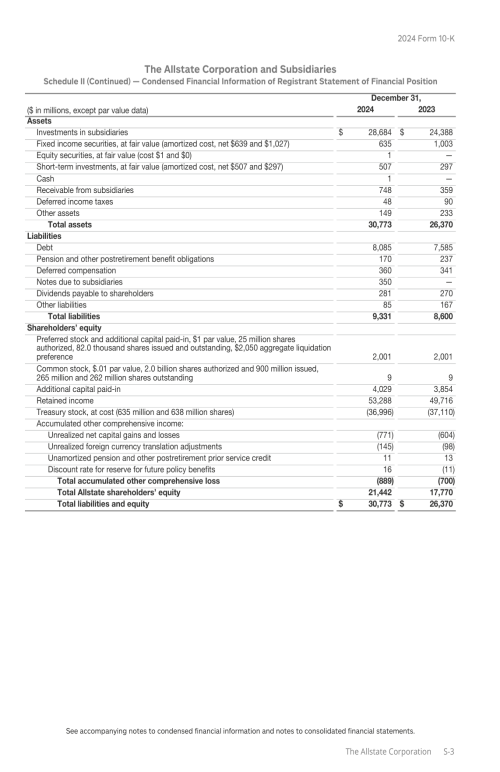
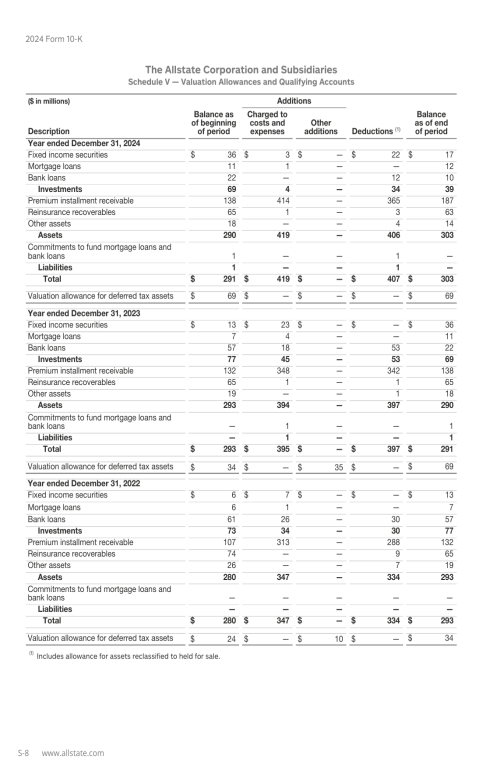
Financial Statement Schedules
Pages
1
2
3
4
5
6
7
8
9
10
11
12
13
14
15
16
17
18
19
20
21
22
23
24
25
26
27
28
29
30
31
32
33
34
35
36
37
38
39
40
41
42
43
44
45
46
47
48
49
50
51
52
53
54
55
56
57
58
59
60
61
62
63
64
65
66
67
68
69
70
71
72
73
74
75
76
77
78
79
80
81
82
83
84
85
86
87
88
89
90
91
92
93
94
95
96
97
98
99
100
101
102
103
104
105
106
107
108
109
110
111
112
113
114
115
116
117
118
119
120
121
122
123
124
125
126
127
128
129
130
131
132
133
134
135
136
137
138
139
140
141
142
143
144
145
146
147
148
149
150
151
152
153
154
155
156
157
158
159
160
161
162
163
164
165
166
167
168
169
170
171
172
173
174
175
176
177
178
179
180
181
182
183
184
185
186
187
188
189
190
191
192
193
194
195
196
197
198
199
200
201
202
203
204
205
206
207
208
209
210
211
212
213
214
215
216
217
218
219
220
221
222
223
224
225
226
227
228
229
230
231
232
233
234
235
236
237
238
239
240
241
242
243
244
245
246
247
248
249
250
251
252
253
254
255
256
257
258
259
260
261
262
263
264
265
266
267
268
269
270
271
272
273
274
275
276
277
278
279
280
281
282
283
284
285
286
287
288
289
290
291
292
293
294
295
296
297
298
299
300
301
302
303
304
305
306
307
308
309
310
Search
Go to Home
Open index
Search
Index
Front Cover
Letter from Chair, President & CEO
Letter from Independent Directors
Notice of 2025 Annual Meeting of Shareholders
Table of Contents
About Allstate
Voting Roadmap
Corporate Governance
Proposal 1 Election of 13 Directors
Our Director Nominees
Corporate Governance Highlights
Board Composition and Nomination Process
Evaluating Board Effectiveness
Director Onboarding and Continuing Education
The Board and its Committees
Management Succession Planning
Risk and Return Management Oversight
Director Compensation
Executive Compensation
Proposal 2 Say-on-Pay: Advisory Vote on the Compensation of the Named Executives
Compensation Discussion and Analysis
Compensation Committee Report
Summary Compensation Table
Grants of Plan-Based Awards at Fiscal Year-end 2024
Outstanding Equity Awards at Fiscal Year-end 2024
Option Exercises and Stock Vested During 2024
Retirement Benefits
Non-Qualified Deferred Compensation at Fiscal Year-end 2024
Potential Payments as a Result of Termination or Change in Control (CIC)
Estimate of Potential Payments Upon Termination
CEO Pay Ratio
Pay Versus Performance Table
Audit Committee Matters
Proposal 3 Ratification of Deloitte & Touche LLP as the Independent Registered Public Accountant for 2025
Auditor Fees
Audit Committee Report
Sustainability at Allstate
Increasing Value for Customers and Shareholders
Navigating Climate Risk
Creating Opportunity for Employees
Improving Communities
Oversight of Sustainability
Stock Ownership Information
Proxy and Voting Information
Appendix A – Definitions of Non-GAAP Measures
Appendix B – Categorical Standards of Independence
Appendix C – Executive Officers
Helpful Links and Resources
Table of Contents 10K
Item 1. Business
Overview
Strategy and Segment Information
Regulation
Human Capital
Website
Other Information About Allstate
Information about our Executive Officers
Forward-Looking Statements
Item 1A. Risk Factors
Item 1B. Unresolved Staff Comments
Item 1C. Cybersecurity
Item 2. Properties
Item 3. Legal Proceedings
Item 4. Mine Safety Disclosures
Item 5. Market for Registrant's Common Equity, Related Stockholders Matters and Issuer Purchases of Equity Securities
Item 6. [Reserved]
Item 7. Management's Discussion and Analysis of Financial Condition and Results of Operations
Item 7A. Quantitative and Qualitative Disclosures About Market Risk
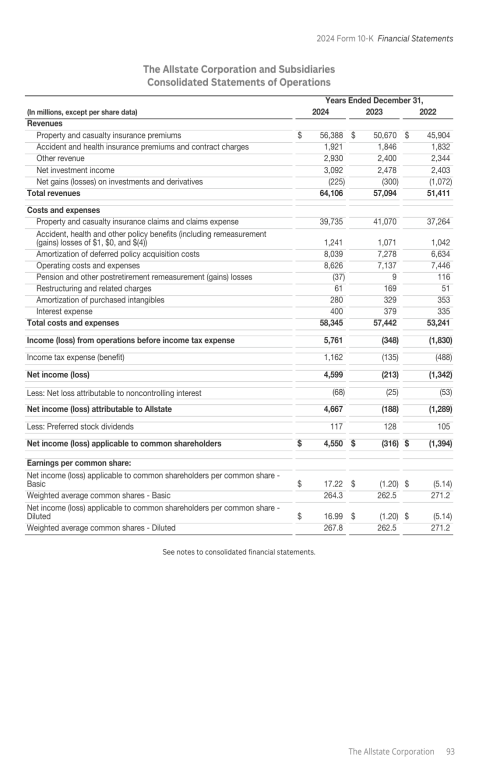
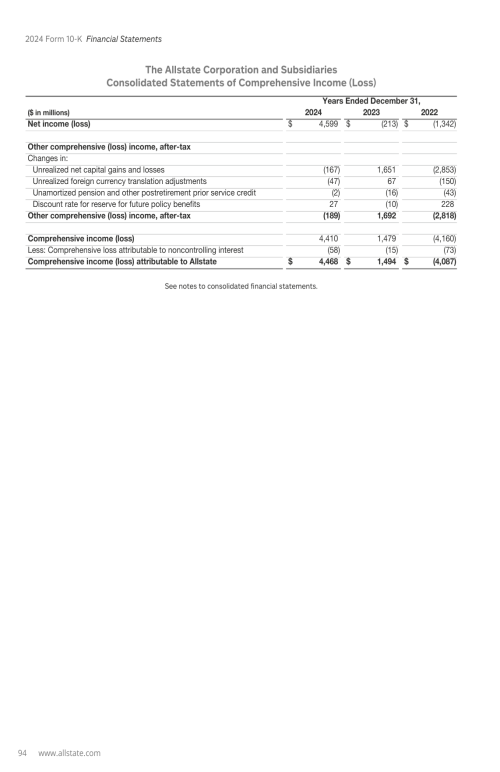
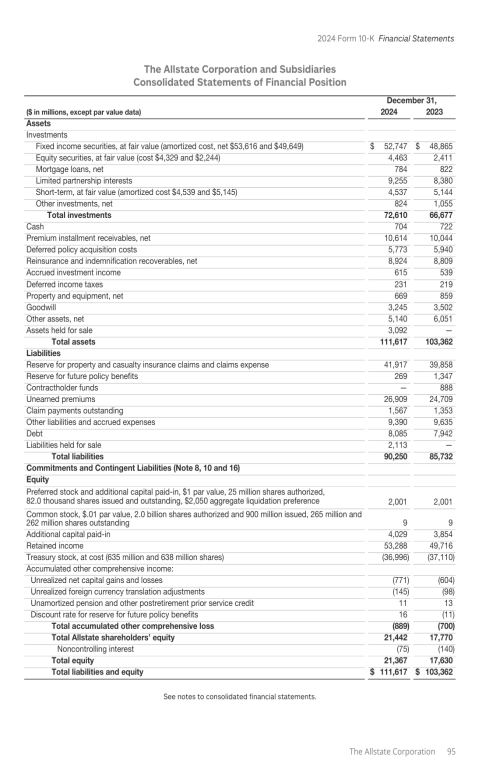
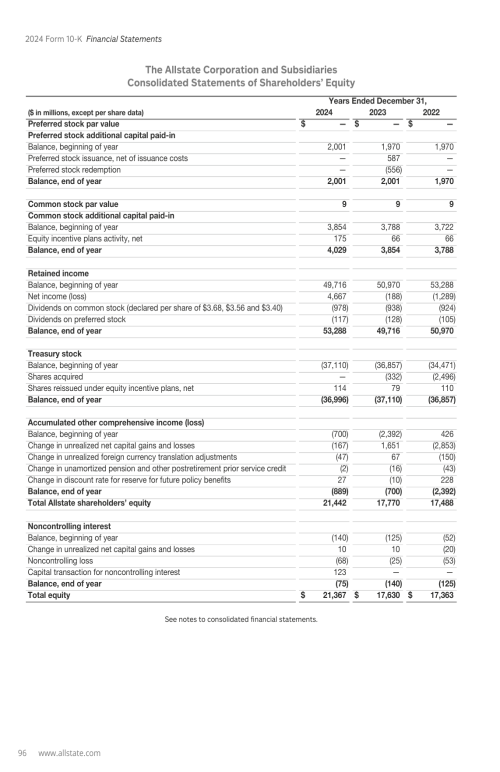
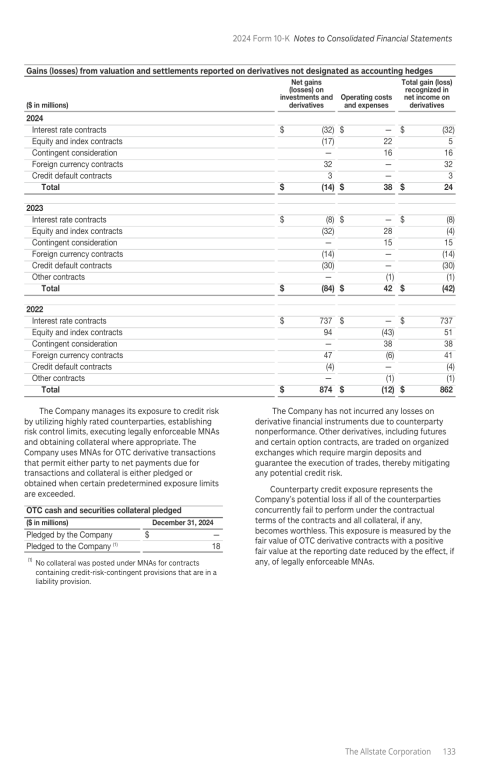
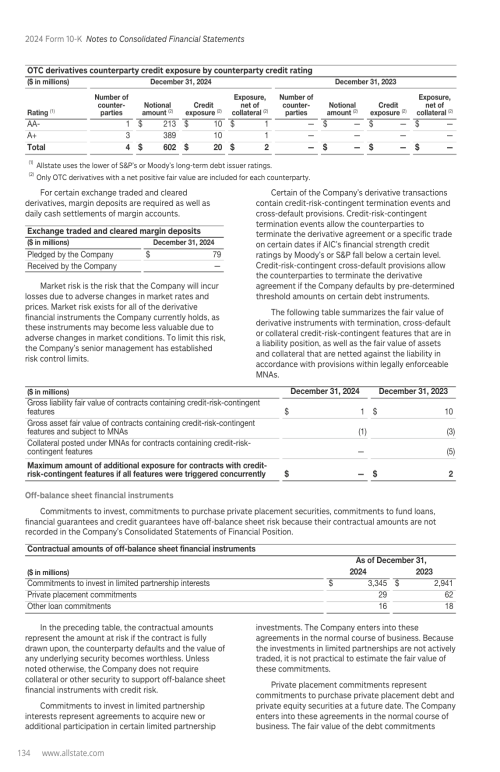
Item 8. Financial Statements and Supplementary Data
Item 9. Changes in and Disagreements with Accountants on Accounting and Financial Disclosure
Item 9A. Controls and Procedures
Item 9B. Other Information
Item 9C. Disclosure Regarding Foreign Jurisdictions that Prevent Inspections
Item 10. Directors, Executive Officers and Corporate Governance
Item 11. Executive Compensation
Item 12. Security Ownership of Certain Beneficial Owners and Management and Related Stockholder Matters
Item 13. Certain Relationships and Related Transactions, and Director Independence
Item 14. Principal Accounting Fees and Services
Item 15. Exhibits and Financial Statement Schedules
Item 16. Form 10-K Summary
Signatures
Financial Statement Schedules
Search